
Hay Weather Index
Hay Weather Index Map
Hay Weather Index for Your Location
Static Hay Weather Index Graphics
Cut Day 1
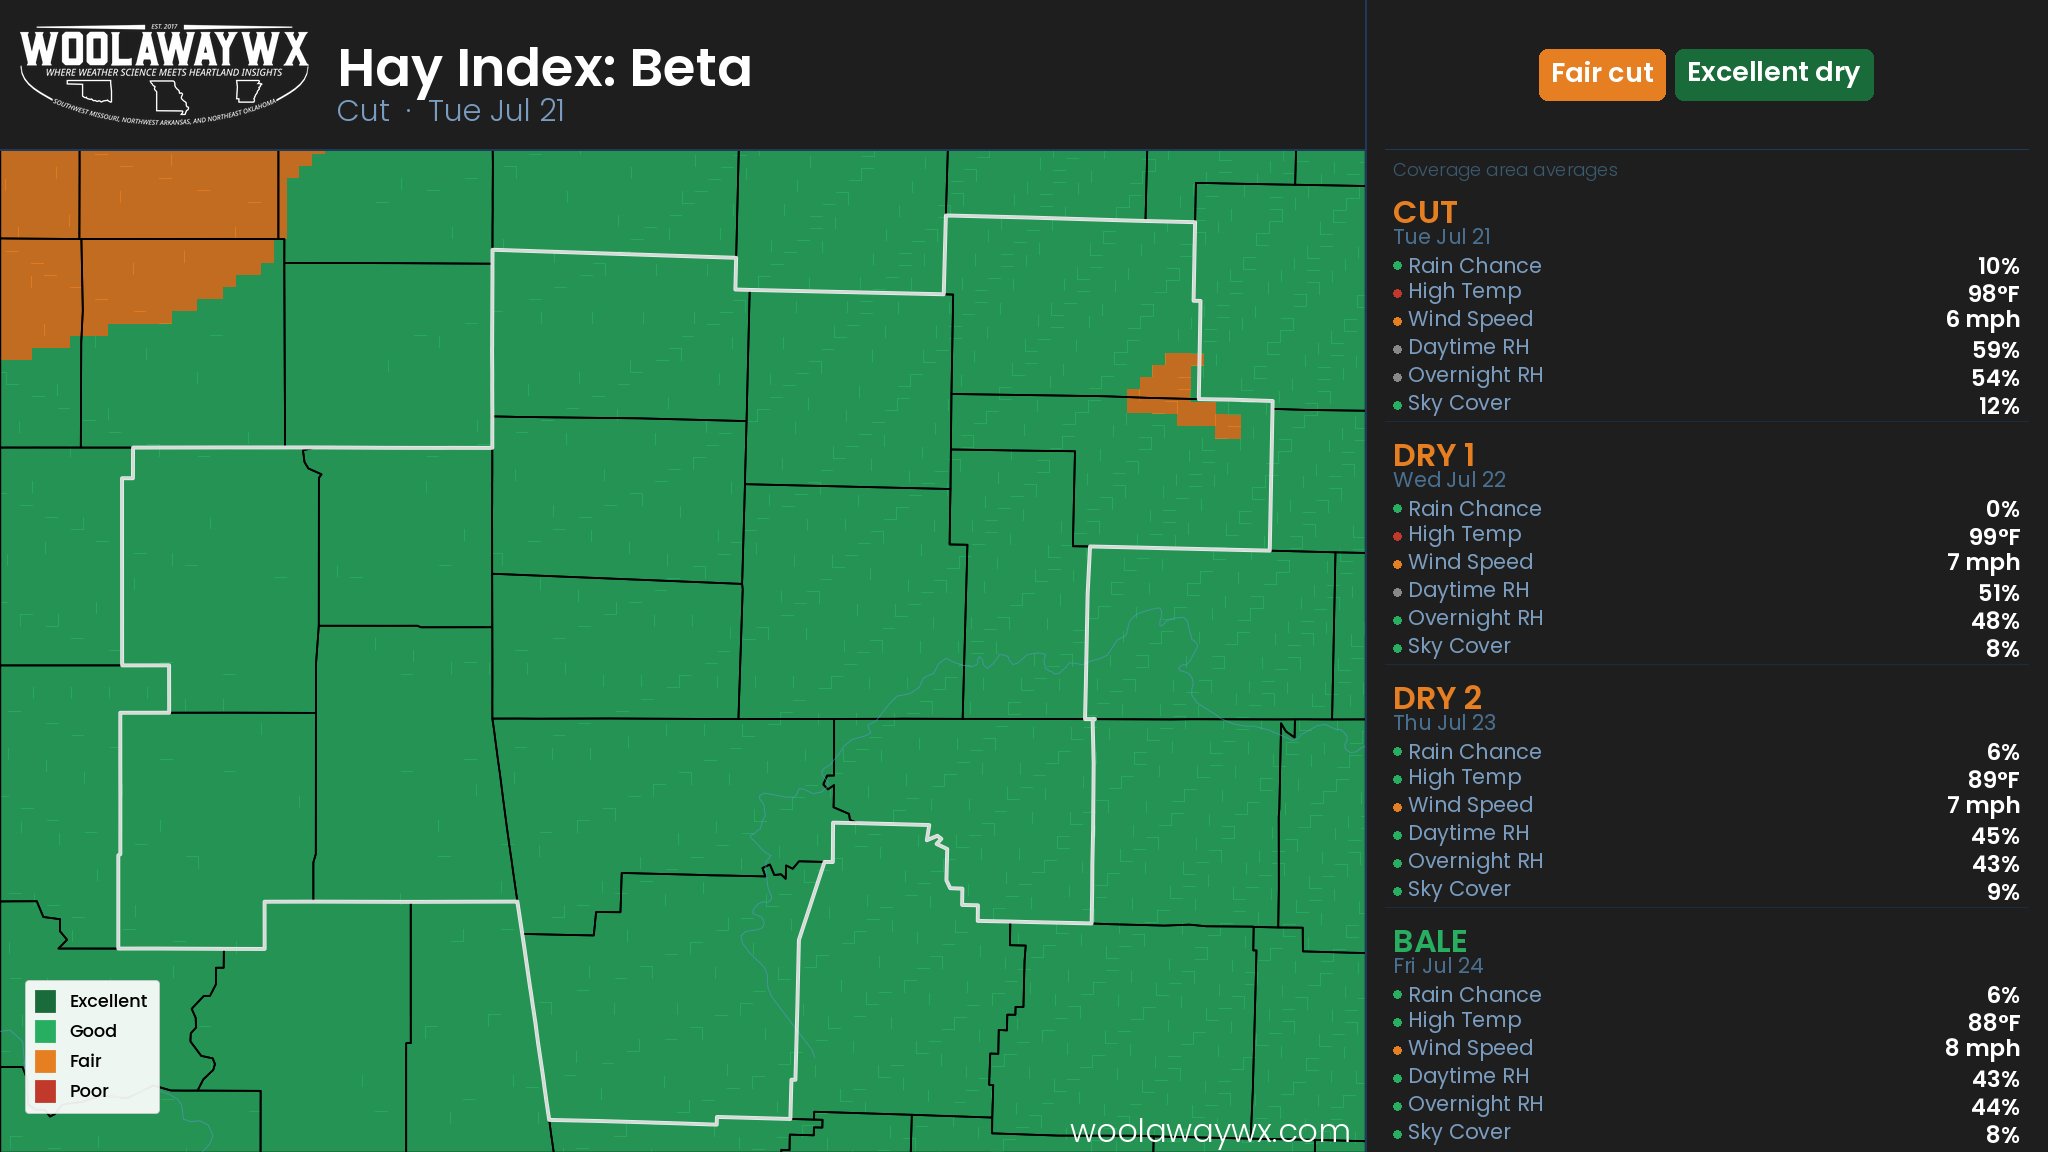
Forecast notes loading…
Cut Day 2
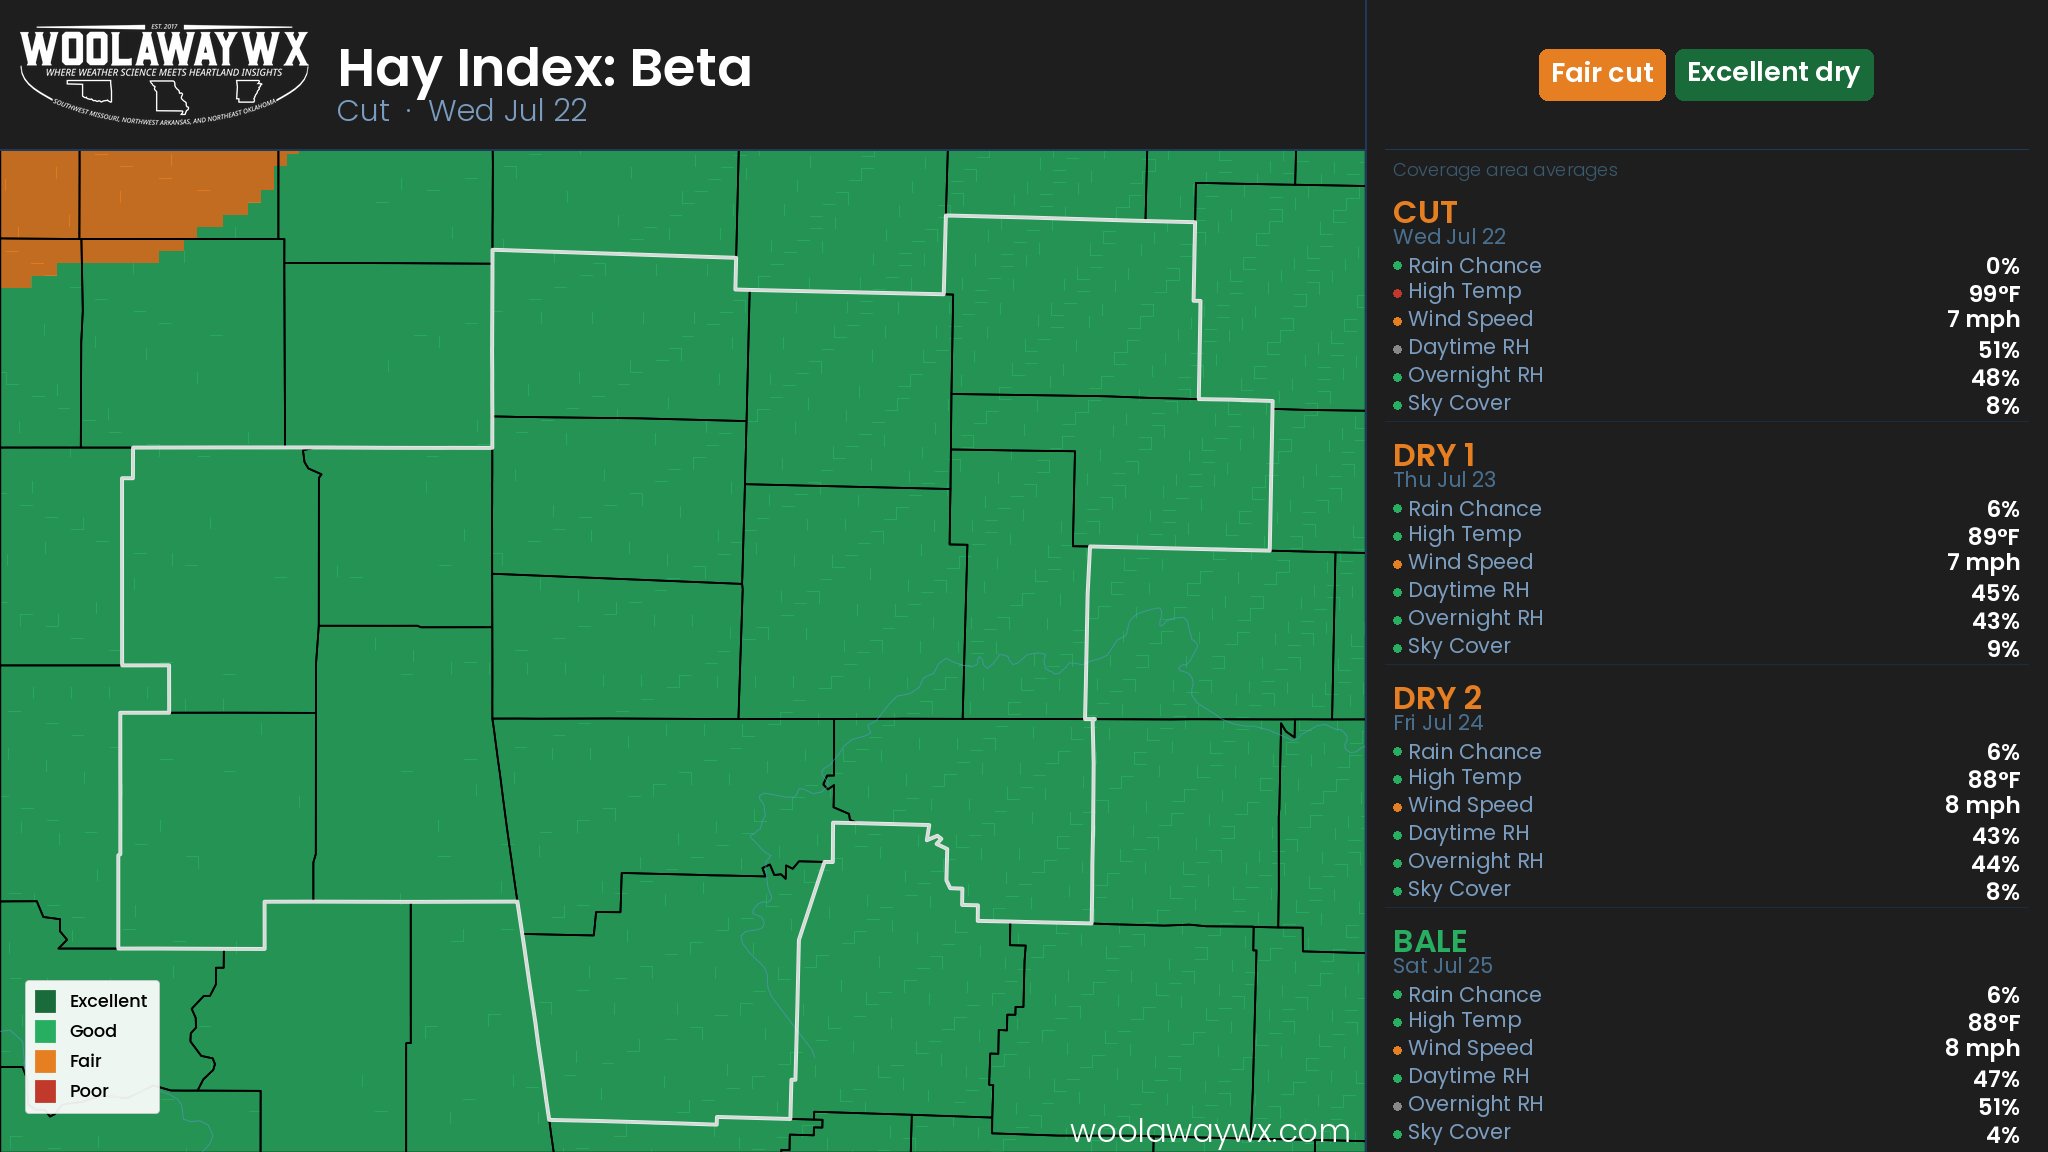
Forecast notes loading…
Cut Day 3
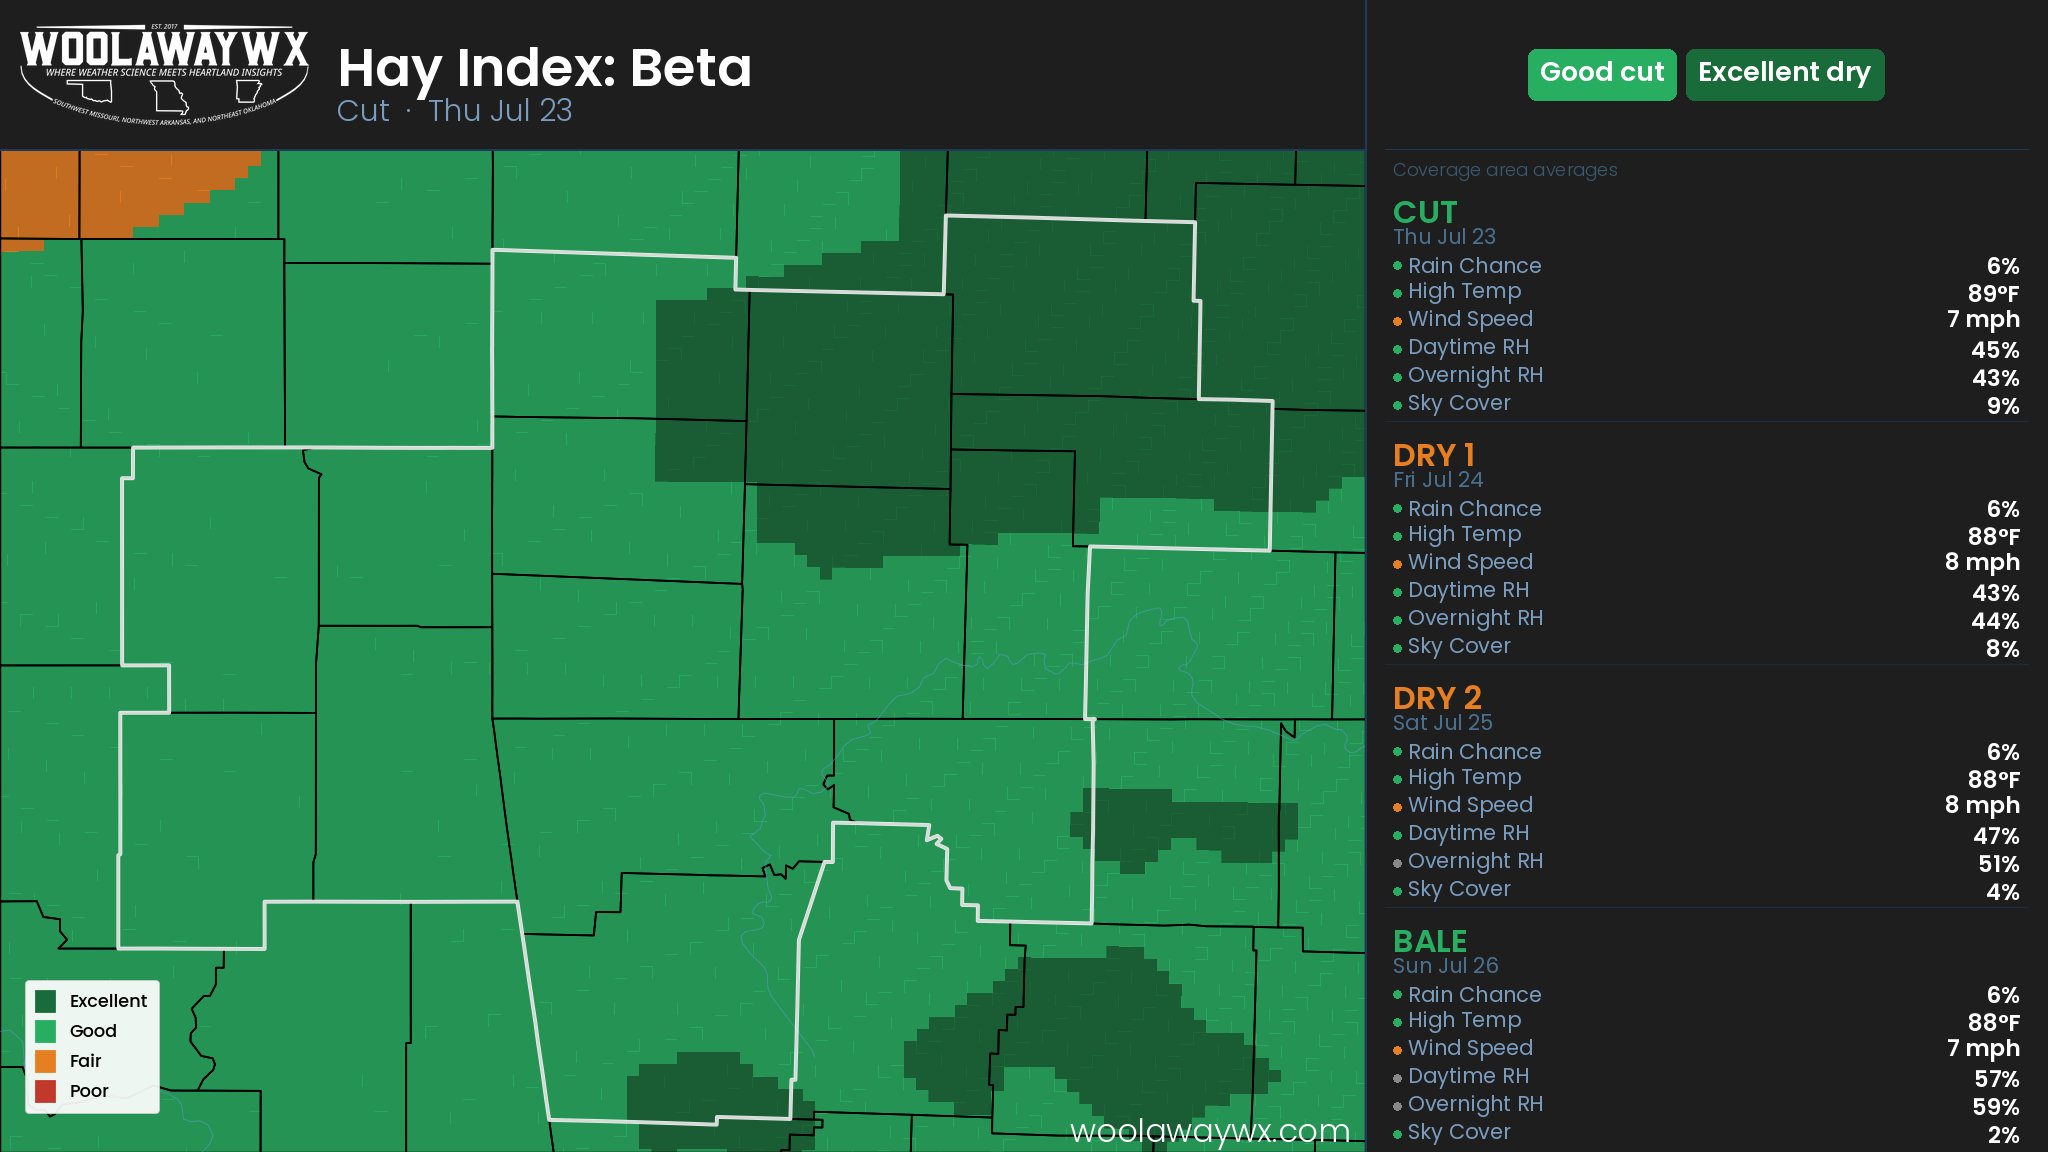
Forecast notes loading…
About the Hay Weather Index
What Is the HWI?
The Hay Weather Index is a 1–10 score unique to WoolawayWx that rates weather conditions for a full hay cycle — Cut, Dry, Dry, and Bale — across four consecutive days. A score of 1 is poor and 10 is excellent. Factors include precipitation chance, temperature, wind speed, relative humidity, sky cover, and overnight humidity recovery, all weighted differently depending on the phase.
Map & Static Graphics
The regional map and the static PNG graphics are generated by the WoolawayWx backend using gridded NDFD forecast data from the National Weather Service. They are updated a few times per day as new model runs become available — not in real time. They cover the full WoolawayWx service area and show three separate cut-day windows side by side, but they may be several hours old depending on when you are viewing them.
Location-Based Forecast
The location-based section fetches live hourly data directly from the NWS gridpoints API for your specific coordinates or ZIP code. It runs the same scoring math as the regional map but on data pulled at the moment you request it, so it reflects the most current available forecast. Use this for a precise reading at your exact location rather than a broad regional overview.